Wildlife Rescue
Provided critical support to wildlife through rescue, medical treatment, and rehabilitation efforts.
Total Wildlife Rescued
1000+ animals
Successful Releases
900+ animals returned
Total Species Helped
30+ species
Recent Rescue Highlights
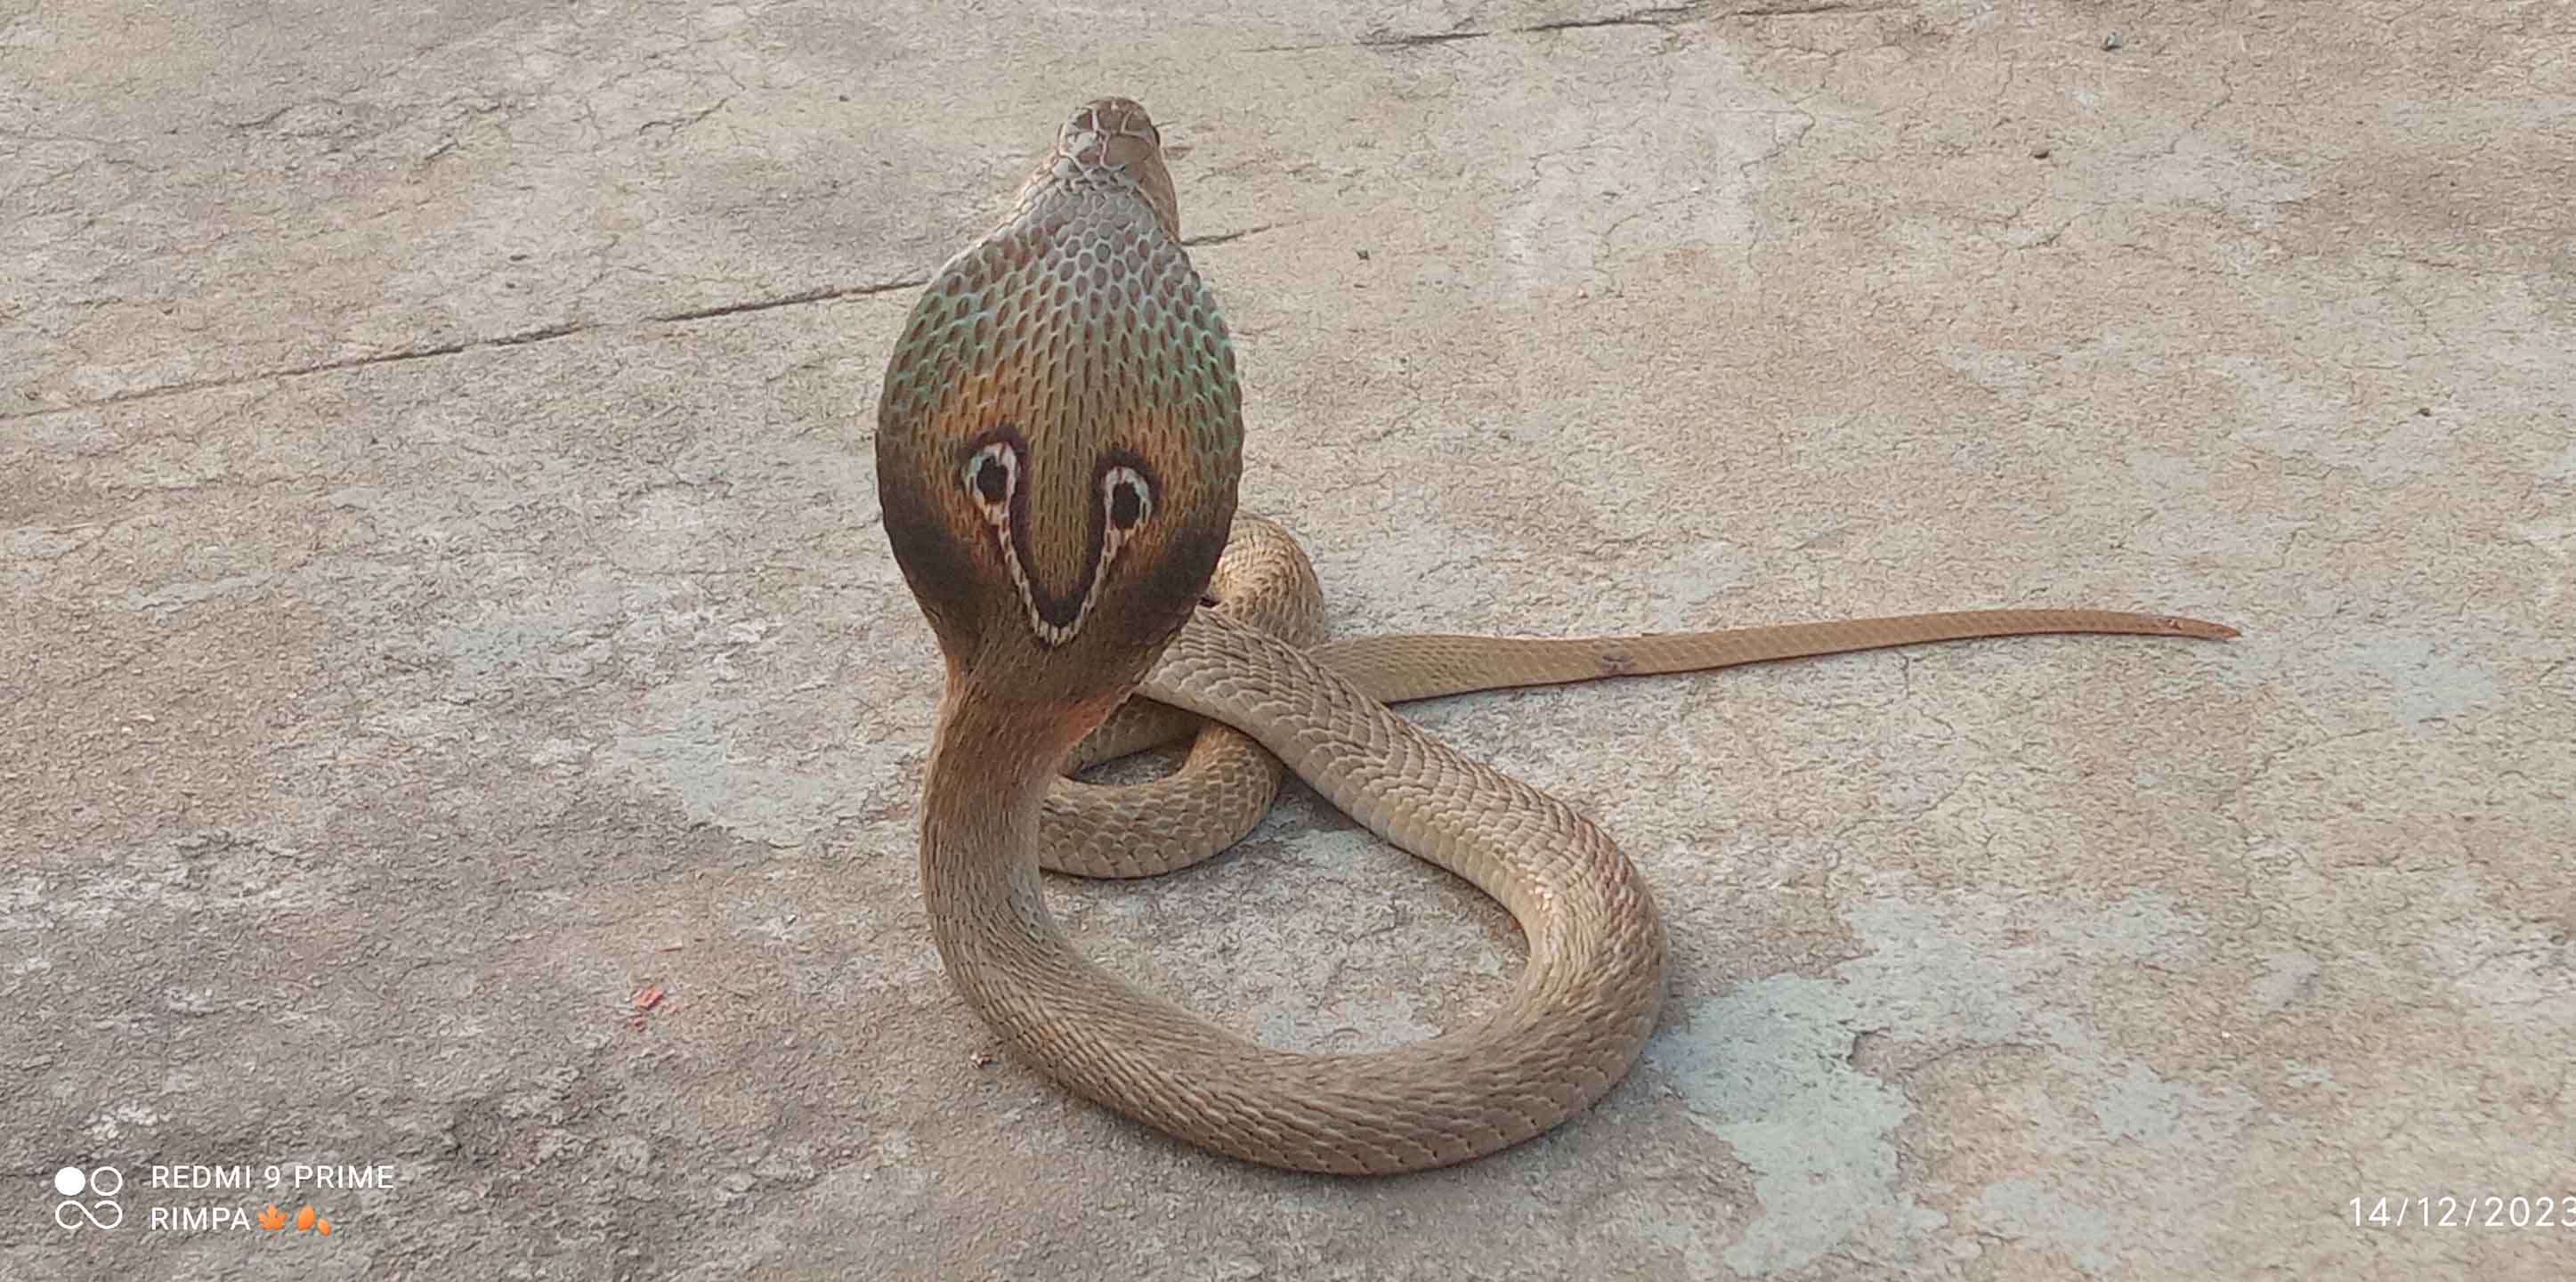
Spectacled Cobra
14.12.2023 - 3:30 PM
Basipur, Gurap, Hooghly
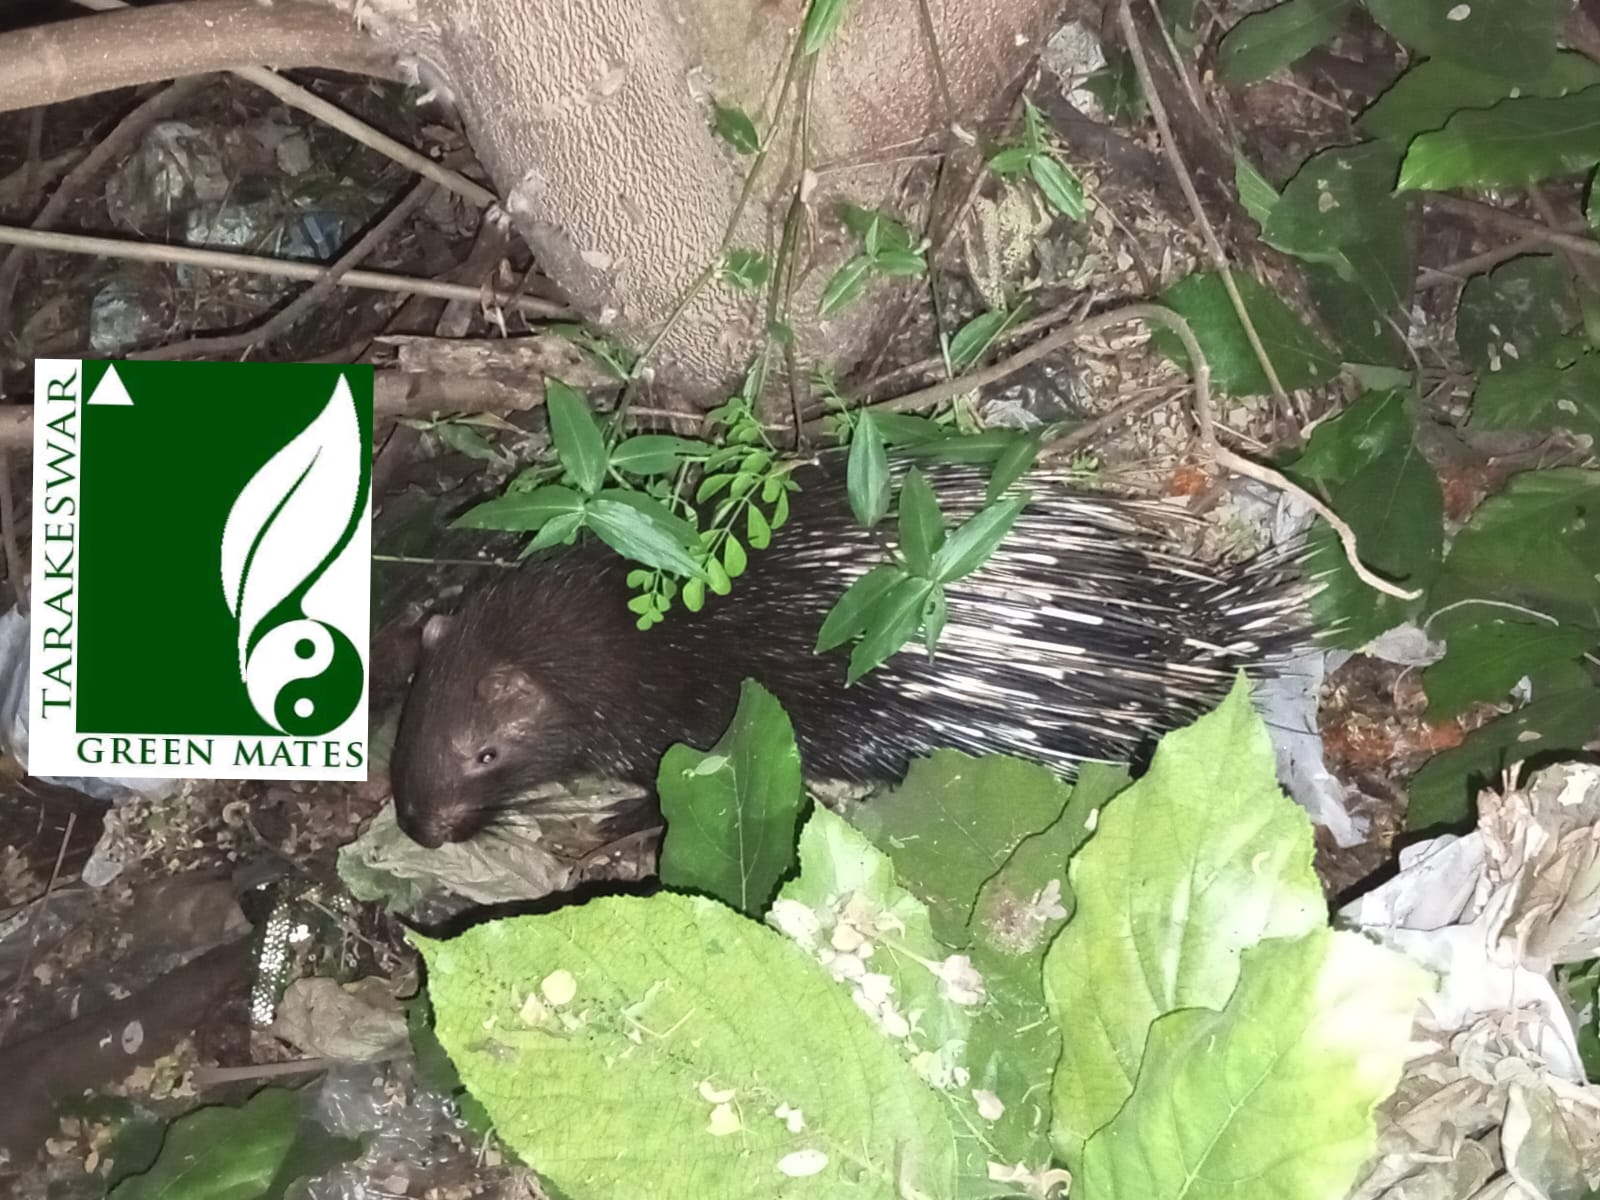
Porcupine
21.10.2023 - 10:15 pm
Tarakeswar, Hooghly
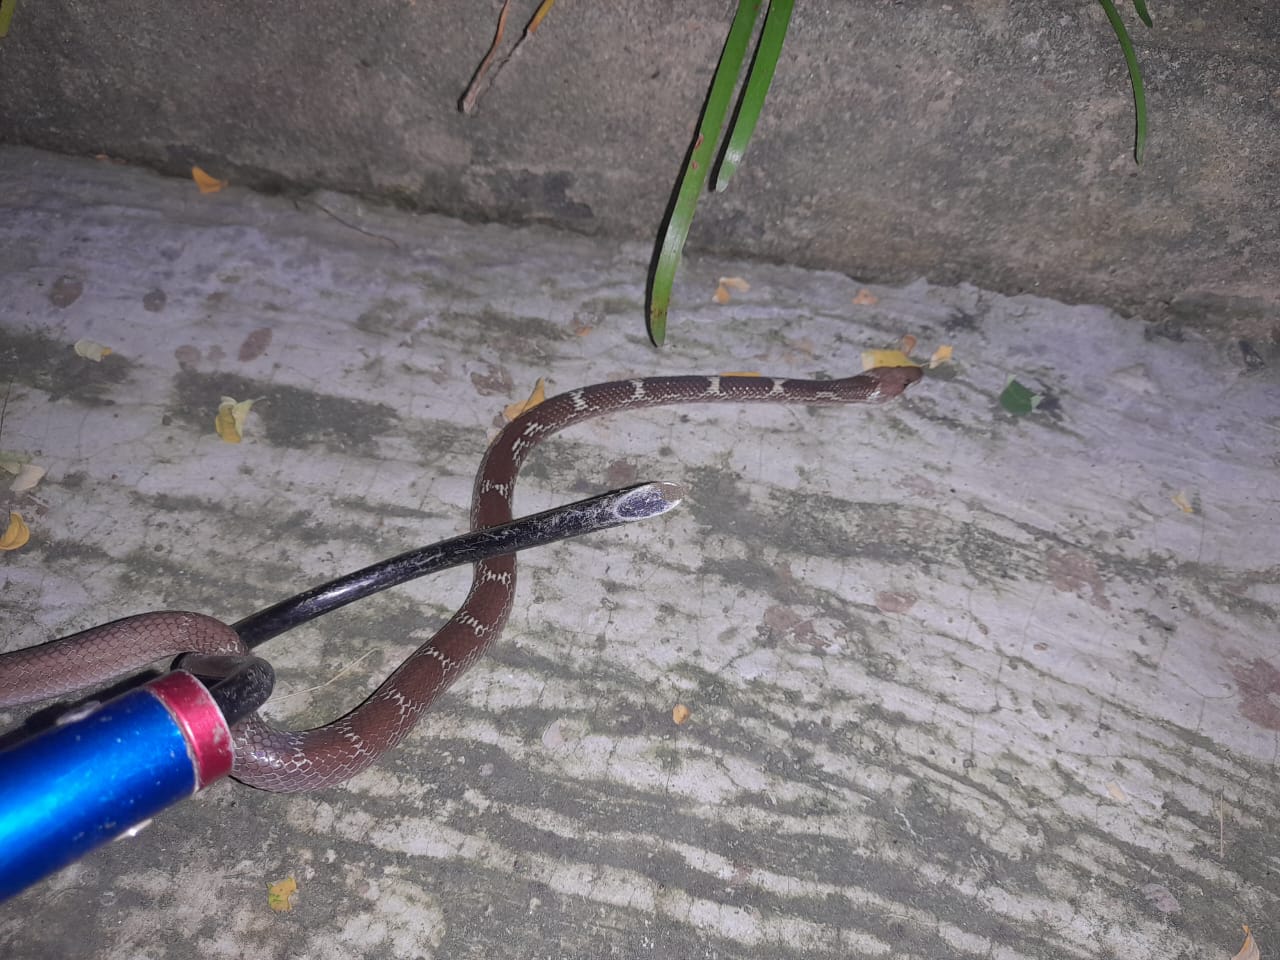
Common Wolf Snake
15.10.2023 - 6:48 PM
Routhpur, Hooghly
Rescue Data Visualization (2023-2024)
Our Rescue Data Visualization section offers a comprehensive look at our wildlife rescue activities during 2023-2024. Through a series of detailed charts and graphs, you can explore the diversity of species rescued, assess the success rates of our efforts, and understand the geographic spread of our operations. These visuals highlight seasonal trends and peak activity periods, offering clear insights into our ongoing commitment to protecting and rehabilitating wildlife.
Rescue Categories
A pie chart categorizing rescues into different types of animals: Reptile, Bird, Mammal, Others.

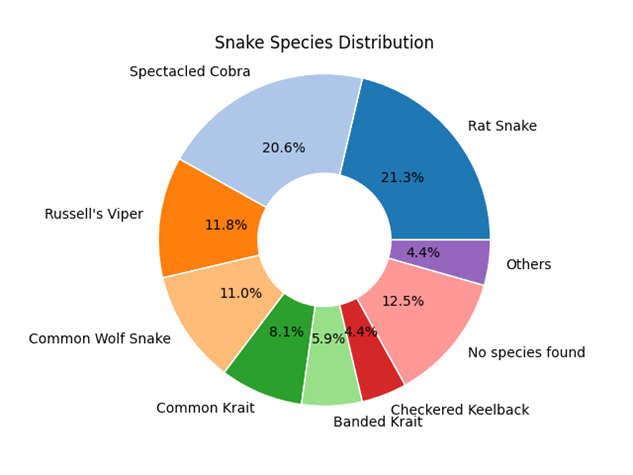
Snake Species Breakdown
A detailed pie chart showing the species of snakes rescued: Rat Snake, Russell's Viper, Spectacled Cobra, Common Wolf Snake, Banded Krait, Common Krait, Checkered Keelback.
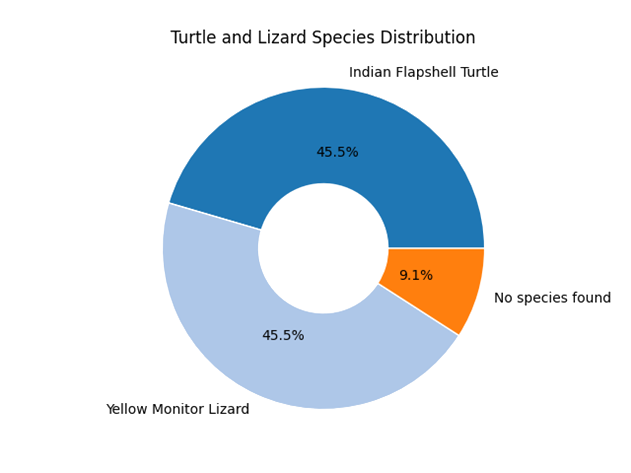
Turtle & Lizard Species
A detailed pie chart showing the species of turtles and lizards rescued: Indian Flapshell Turtle, Indian Peacock Softshell Turtle, Yellow Monitor Lizard, Bengal Monitor Lizard, Others.
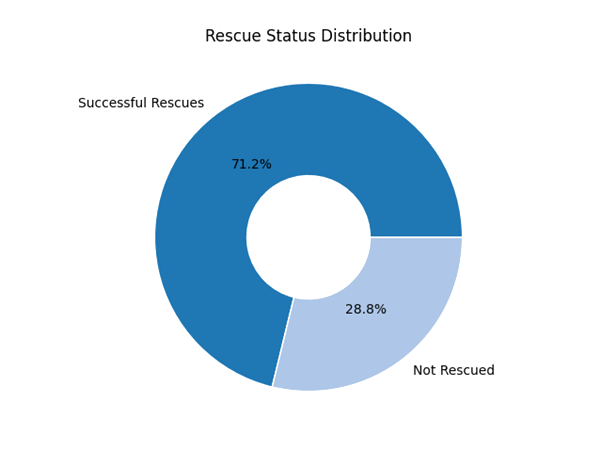
Successful Rescues
A pie chart showing the proportion of successful rescues vs. not rescued attempts (Successful: 145, Not Rescued: 65).
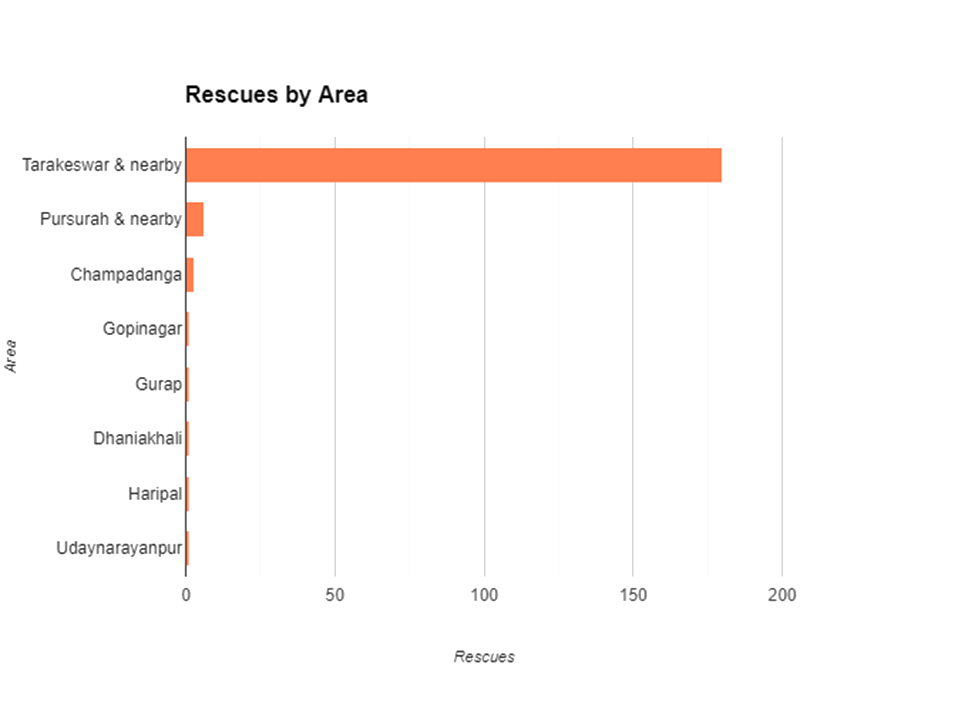
Rescues by Area
A bar graph displaying the number of rescue attempts by area: Tarakeswar and nearby (180), Pursurah (6), Champadanga (3), and smaller numbers for other areas.
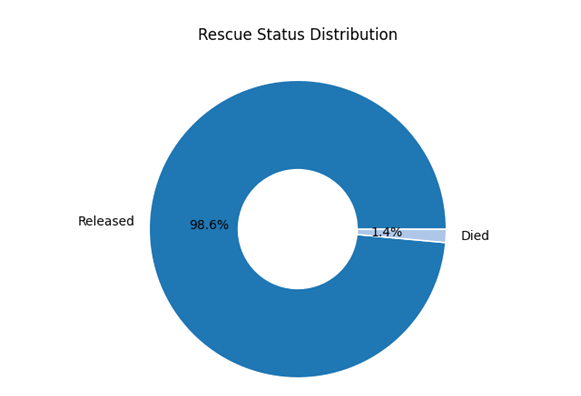
Rescue Status
A pie chart depicting the status of rescued wildlife: Released: 98.6%, In Treatment: 3.5%, Died: 1.4%.
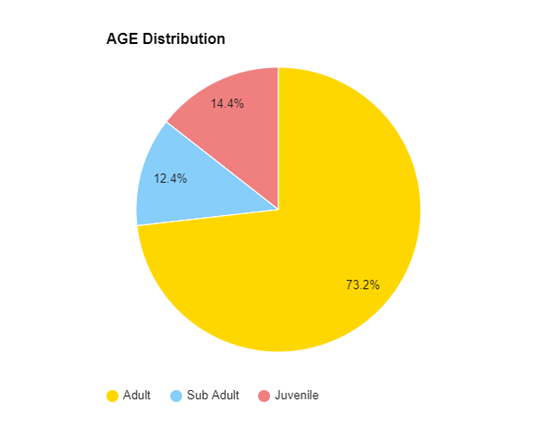
Age Distribution
A pie chart depicting the age distribution of rescued wildlife: Juvenile, Sub Adult, Adult.
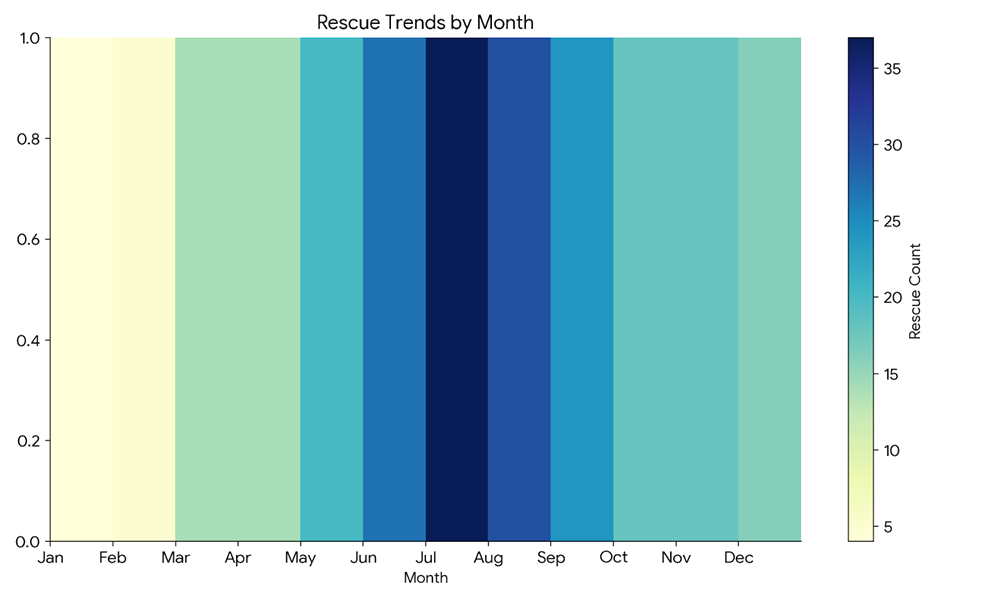
Rescue Trends
A heatmap or timeline showing trends in rescue operations over the year, with peak activity in summer and lower numbers in winter.
Patterns and Trends
- Seasonal Variation: The visualizations illustrate a clear seasonal pattern, with rescue activity generally correlating with temperature and animal activity levels.
- Summer Peak: The summer months, particularly June through August, consistently show the highest levels of rescue activity. This could be attributed to:
- Increased animal activity and visibility
- More people outdoors, leading to more animal encounters
- Breeding seasons for some species
- Winter Lull: The significant drop in rescues during winter months likely reflects reduced animal activity and fewer human-wildlife interactions.
- Gradual Changes: The number of rescues gradually increases from spring to summer and then gradually decreases from late summer through autumn.
- Consistent Year-Round Activity: Despite the peaks and troughs, the rescue team remains active throughout the year, handling rescues even in the quieter months.
This heatmap provides a clear visual representation of the rescue team's activity levels throughout the year, highlighting the busiest periods and overall annual trends in wildlife rescue operations.